Book a demo with us
A learning management system with robust, yet easy-to-use, reporting
Kallidus customers love our learning platform for its comprehensive reporting capabilities and cite lower turnover, higher compliance rates, and reduced risk in the workplace.


Kallidus makes it easier to show the impact
of learning and performance
The reports you need,
when you need them most
![]() Please select the tabs below to see each feature
Please select the tabs below to see each feature
Reporting made simple, fast and effective with Kallidus Learn LMS
Fully supported
by PowerBI
Power BI is a business intelligence tool powered by Microsoft. It integrates with other Microsoft ecosystem products and prioritises ease of use and modern data visualisation techniques. We promised to make it easier. Here’s what we mean:
- New and improved standard reports
- More modern look and feel
- Single hub for all Kallidus reporting
- Cross-product reporting for the Kallidus suite, to link learning and performance

Report on compliance
and learning progress
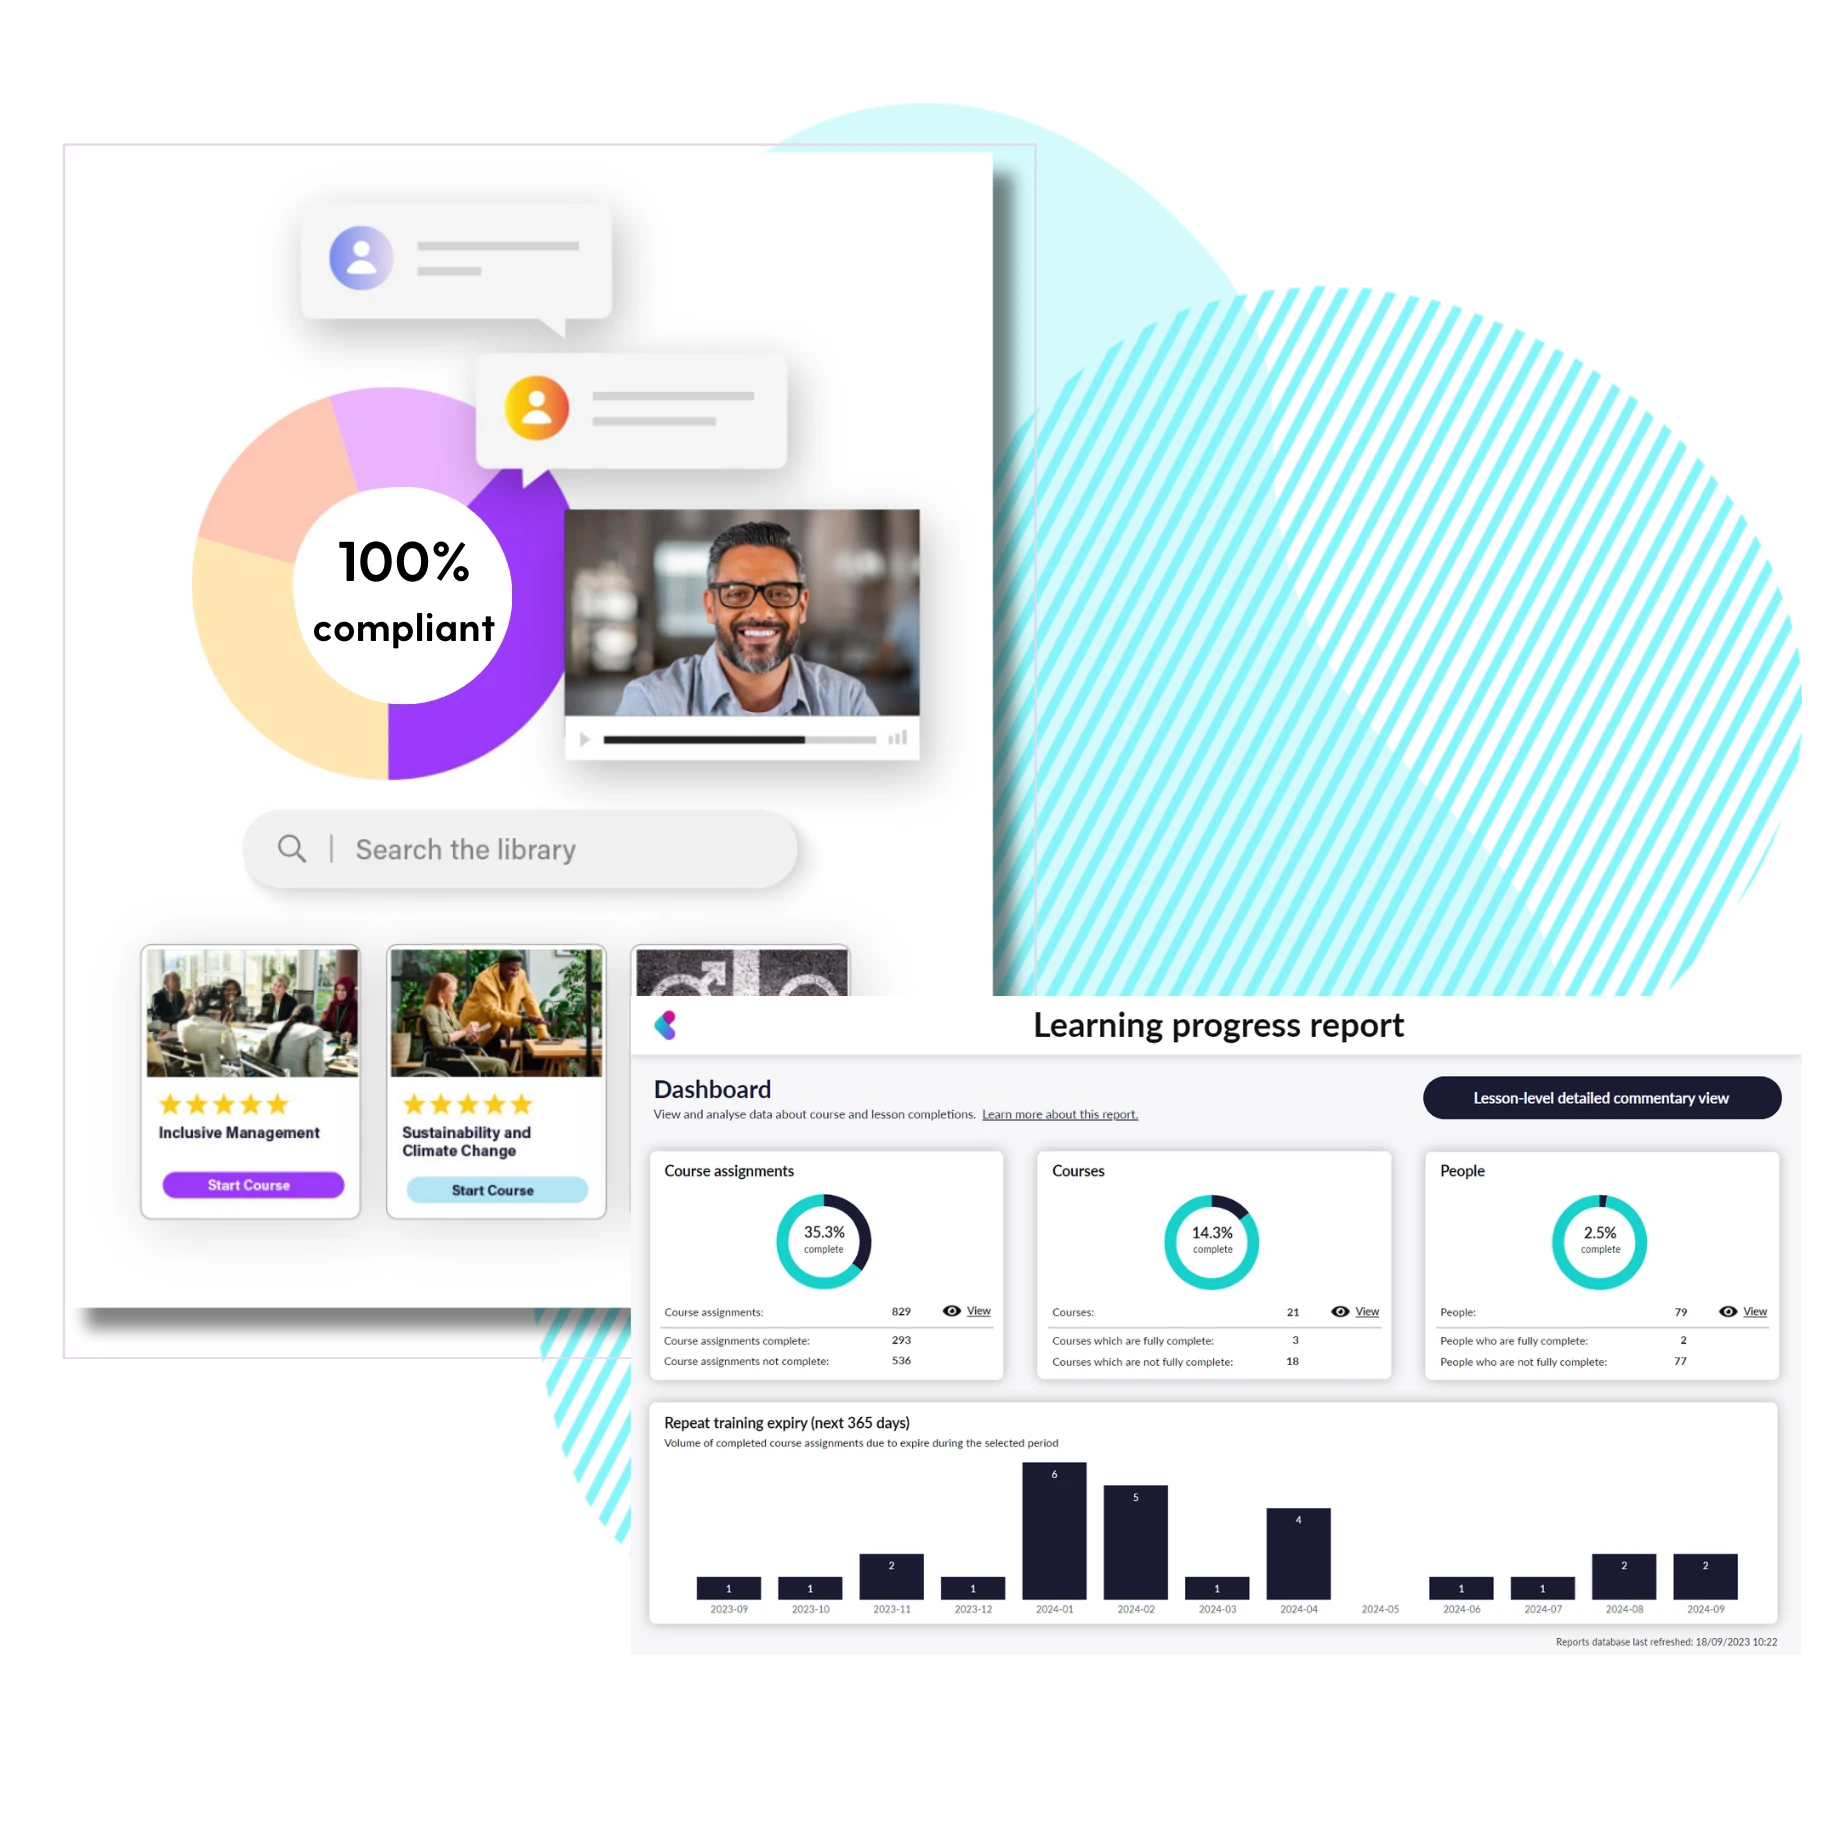
This report is available to all customers with Power BI. We’ll summarise what the report includes, and how it might be used, along with the filter and drill-through options available. Possible uses for this report include:
- See how your people are progressing against their course assignments
- View learning progress for mandatory or elective learning assignments – or both
- See the ‘big picture’ of training that must be completed each month for the coming year

Evaluation is our top used report
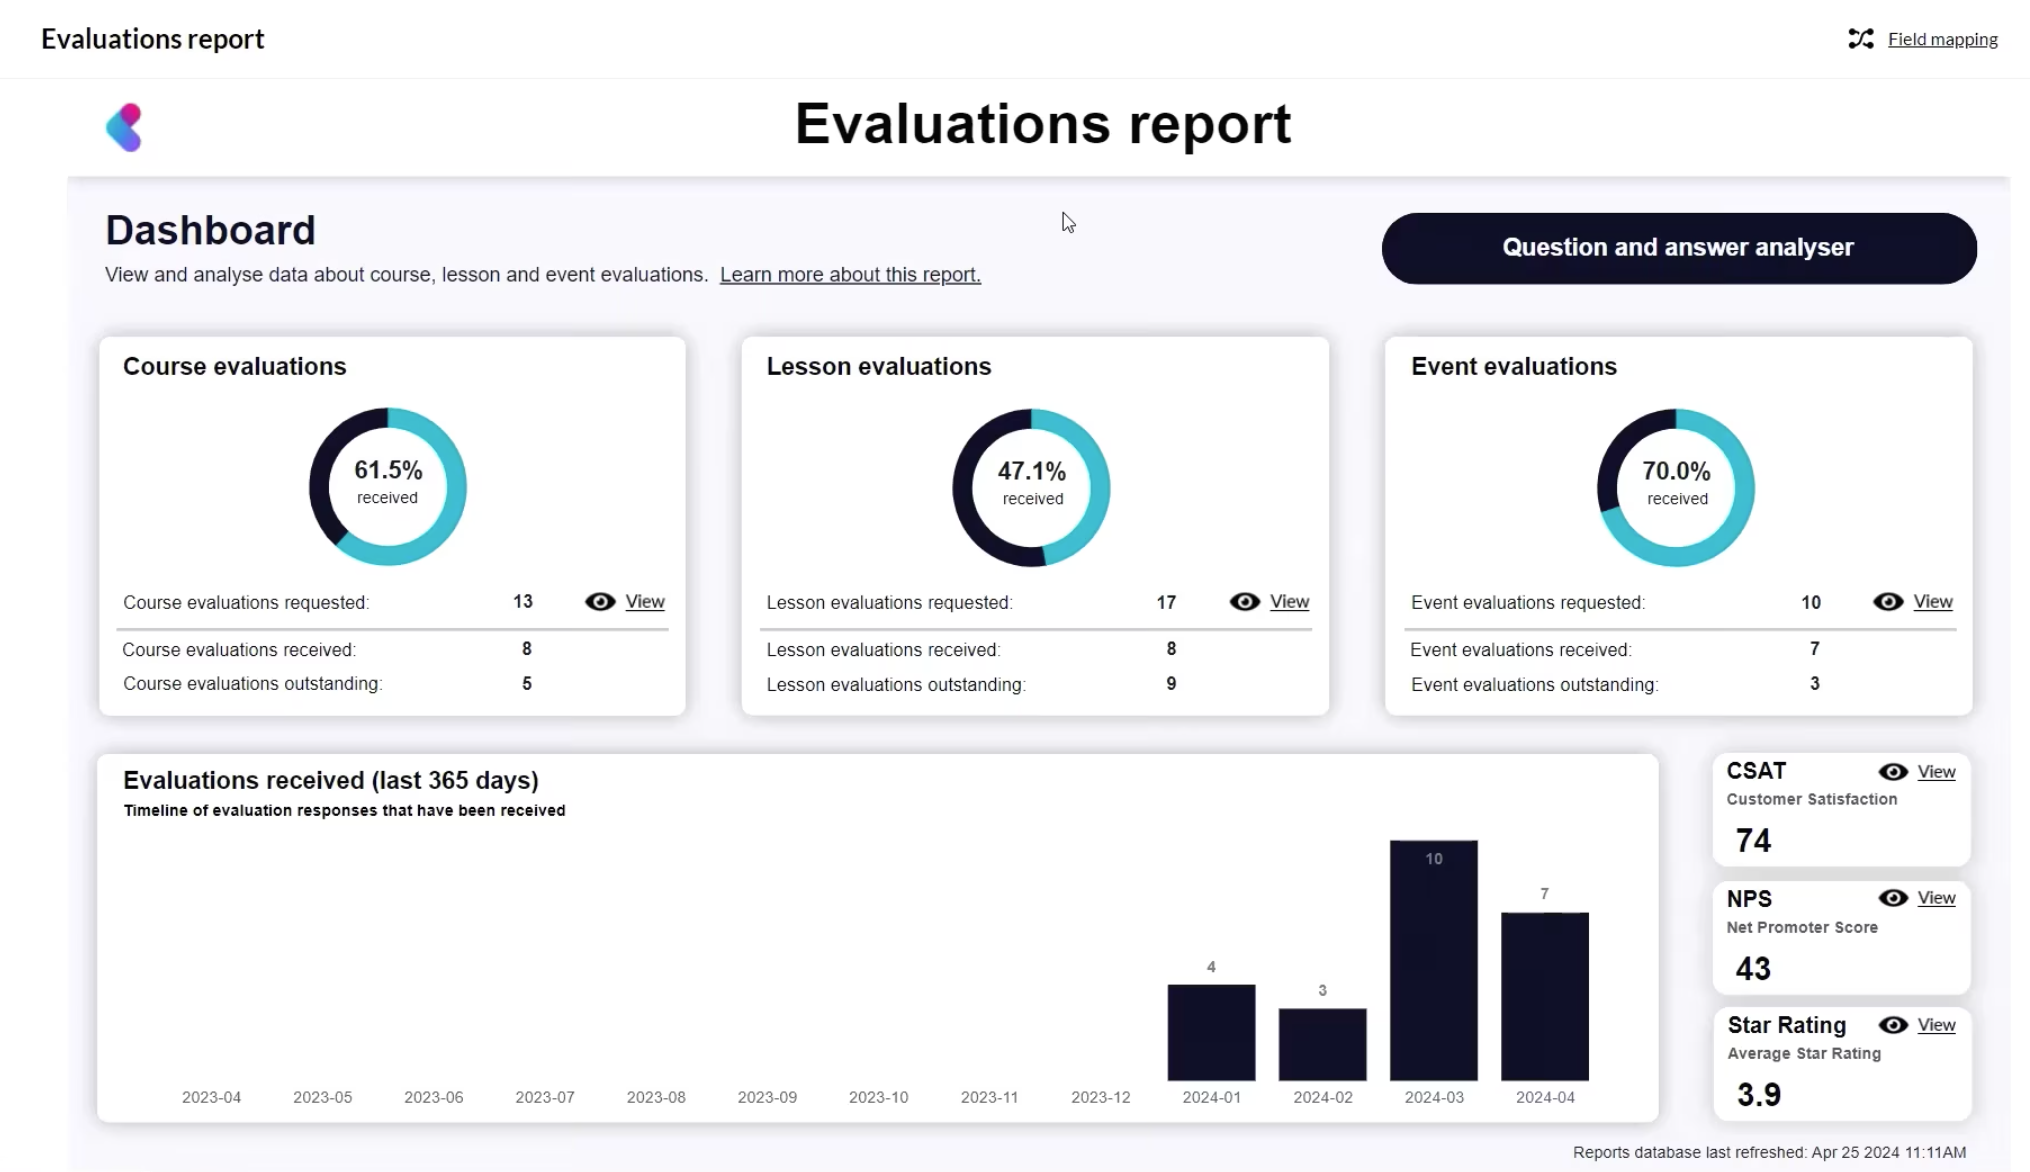
An administrator can assign an evaluation form to a Course, Lesson, or Event in Learn. This form might be the standard evaluation form in Learn or a custom form added to Learn to meet other evaluation needs. The Evaluations report includes:
- The number of evaluation requests sent, received and pending for Courses, Lessons and Events
- The percentage of completed evaluations received compared to the total number requested
- The overall CSAT (Customer Satisfaction) score
- The overall NPS (Net Promoter Score) score
- The overall Star Rating (on a scale of 1 to 5) score
- The option to drill down and view details for a specific question or specific user

Manage and analyze events
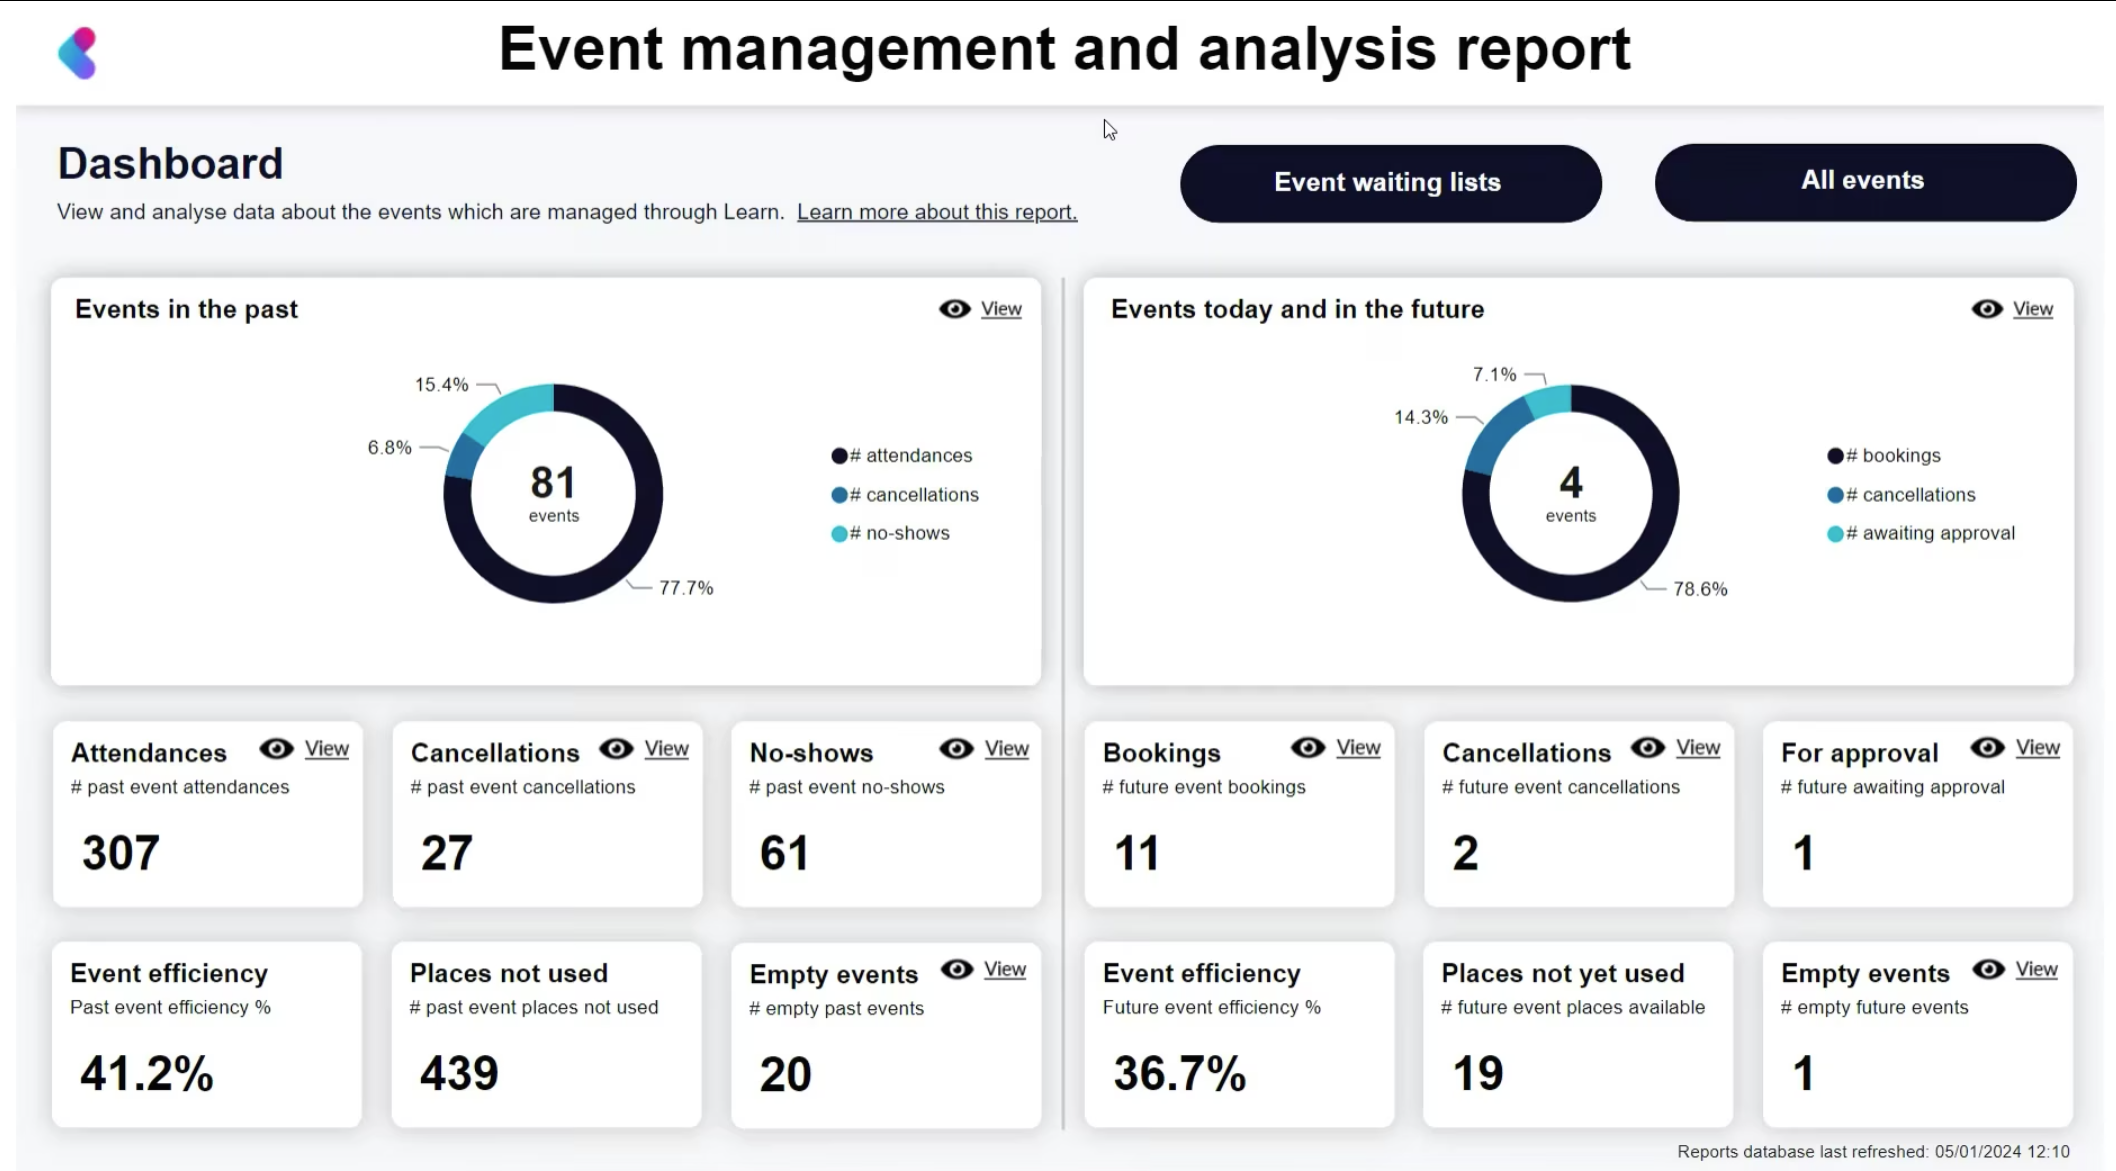
One of the most used reports from our customers, the Event Management report, can be used to:
- Check on a range of key information about your physical and virtual instructor-led events (historic and future Events)
- Housekeeping, including to ensure that event attendance is marked for all Events
- Identify how often (and in what volumes) seats are left vacant on events
- View how many people are no-shows for your events
- See which are the most and least effective events based on seat capacity used


